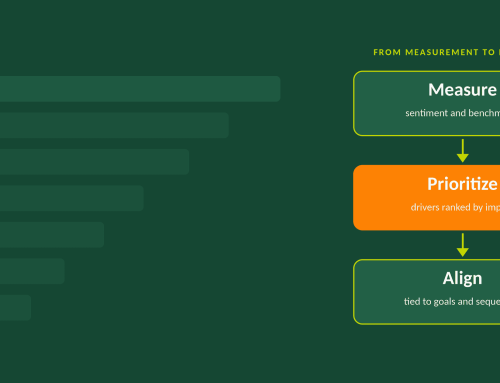
When presenting engagement data to executives, start with the strategic priorities leaders have already set, then show the two to four findings that stand in the way of those priorities, a firm recommendation for each, and two options for carrying it out. Leaders get a clear point of view and a real choice, and the scores stay in the background where they belong.
Engagement results compete for executive attention with priorities that are already on the table, such as a growth plan or an acquisition. Our position is that HR earns that attention by tying each finding to one of those existing priorities, rather than walking leaders through the survey results and a set of abstract scores. Organize the presentation around the goals leaders have already set, give every finding a recommendation along with a choice of how to carry it out, and keep survey categories, scores, and benchmarks in the background – either in an appendix or in a separate accessible document.
Unfortunately, the way engagement results are typically presented (a deck built around survey categories) leaves executives to work out the connection themselves, and in our experience the conversation drifts toward whichever number catches someone’s eye. The pairing of a recommendation, and related options for moving forward with that recommendation, matters as much as the structure. When HR brings a single recommendation, leaders can only accept it or turn it down, and turning it down is the easy choice. When HR brings options that aren’t tied back to a goal, leaders have no way to weigh one against another, so the decision tends to get put off. A recommendation with options, each tied to a goal leaders already hold, gives them a reason to act and a real choice.
Start with the goals leaders have already set
Before a single finding goes on a slide, put the executives’ priorities in front of them: the business goals they have already committed to over the next two to five years, such as entering a new market or integrating an acquisition. Those goals usually sit a level above HR metrics, so the work of the presentation is to show how the people findings bear on them. If you gathered those goals with leadership before the survey launched, you have them in the leaders’ own words. If you did not, pull them from the strategic plan and confirm them in a short conversation before the meeting. This mirrors the first gate in the OGC Workforce Priorities System, organizational alignment, and a finding you cannot connect to a stated goal deserves a second look before it earns a slide.
How many findings belong in the presentation?
Two or three, and never more than four. A fifth finding dilutes the first four, and a short list is one an executive team can act on. Frame each as a challenge to a specific goal: what the analysis found, which goal it affects, and what solving it would do for that goal. A finding that reads “manager feedback is a significant driver of engagement” gives a leader something to nod at. Framed as “the front-line managers you plan to promote into next year’s two new locations receive their lowest marks from their own teams on feedback and coaching,” it gives them something to decide.
Which findings make the cut should come from the analysis of what drives engagement in your own organization, and regression is the tool for that job: it shows which drivers best predict engagement, so an urgent-looking issue with little predictive weight does not take a slot it has not earned. We explain how that ranking works in our comparison of engagement surveys and the Workforce Priorities Diagnostic.
Give each finding one recommendation, stated plainly
Each finding gets a single recommendation, written as a point of view: what we think the organization should do and which goal it serves. A slide that says “consider the following” hands the judgment back to the people who were hoping to receive it. Keep the recommendation to a sentence, and save any hedging for the conversation that follows.
Then offer two options for carrying it out
A recommendation can usually be carried out in more than one way, so each one comes with two specific options. They might differ in scope, in pace, in who delivers the work, or in what they cost; what matters is that leaders can choose based on their own capacity and budget. Each option should already have passed through the other gates (value relative to budget, leadership buy-in, and supporting environment, all covered in our article on the four gates) before it reaches the slide, which means the choice in the room is between workable routes.
Here is how one row of the presentation might look. The example is illustrative and does not describe a client.
| Strategic goal | Finding | Recommendation | Option A | Option B |
|---|---|---|---|---|
| Open two new locations next year, led by managers promoted from the current front-line ranks | Employees give their front-line managers their lowest marks on feedback and coaching, and those skills are the strongest driver of engagement | Build feedback and coaching skills in current front-line managers before the new locations open | Skills-based training for all front-line managers, with a 90-day practice period and manager check-ins | Start with the managers most likely to be promoted into the new locations, then extend to the rest based on what the first group shows |
Where do scores and benchmarks go?
Into the backup material, ready for the executive who asks. Leaders often value a benchmark comparison, and it deserves a place in the appendix; a benchmark shows where the company stands, and the recommendations show what to do about it. Leading with the scores invites a debate about the scores.
What can derail the meeting, and how the structure helps
The two derailments we see most often are a decision to do nothing and an executive who gets caught up in a detail that has little to do with the goals. Tying every finding to a goal leaders already hold gives inaction a visible cost, because the goal stays out of reach. Sometimes a smaller first step or a later start is the right call, and that is a legitimate decision as long as someone makes it deliberately and sets a date to revisit it. When the conversation fastens on a single survey comment or one department’s score, the structure supplies the question that brings it back: which goal does this affect, and does it change the recommendation?
Next steps
Either at the close of the meeting, or at the close of a follow-up meeting, for each recommendation, leaders should leave with the option they chose, an owner, a start date, and a measure of whether it is working. That measure should trace back to the goal on the first slide. A full diagnostic belongs on a cycle of two to three years, so a lighter check-in can track the specific initiative in between, and the leaders who chose it will know exactly what they asked the data to show.
Heading into an executive meeting with engagement results and no clear way to turn them into decisions? Let’s talk through how to connect your findings to your leaders’ goals and shape recommendations and options they can act on.
Have a specific question about how this applies to your organization? Our FAQ page covers common questions on talent systems, leadership development, and engagement data.
Contact Us